Charts and Maps
In 2013 and 2014, I developed a proprietary database, which captured where and when the women of Atelier 17 exhibited their prints in solo and group shows across the United States and the world between roughly 1940 and 1955.
This data laid the foundations for my prize-winning article, “Networks of Abstraction: Postwar Printmaking and Women Artists of Atelier 17,” published on the website of the Smithsonian Institution’s Archives of American Art. With additional research, I subsequently revised and expanded this article to become Chapter 5 in my book, which demonstrates the power of women’s networking and the professionalizing benefits of exhibiting their Atelier 17 prints nationally and globally.1 At the time of the article’s publication in 2014, the data set numbered 1,700 records, and it has since grown to nearly 2,200 entries.
Initially, I visualized the data using Viewshare, an online geo-mapping platform developed by the Library of Congress. Unfortunately, Viewshare was retired as of March 20, 2018. Subsequently, I identified Google Fusion Tables as a successor to share the dataset for readers of my book. This service will also be discontinued on December 3, 2019.
While I recognize there might be another platform for displaying my data, the reality is these cloud-based services have only a finite lifespan. Instead of resurrecting my data on yet a third site, I have decided to publish three new charts, updated since the 2014 article, on this web supplement.2
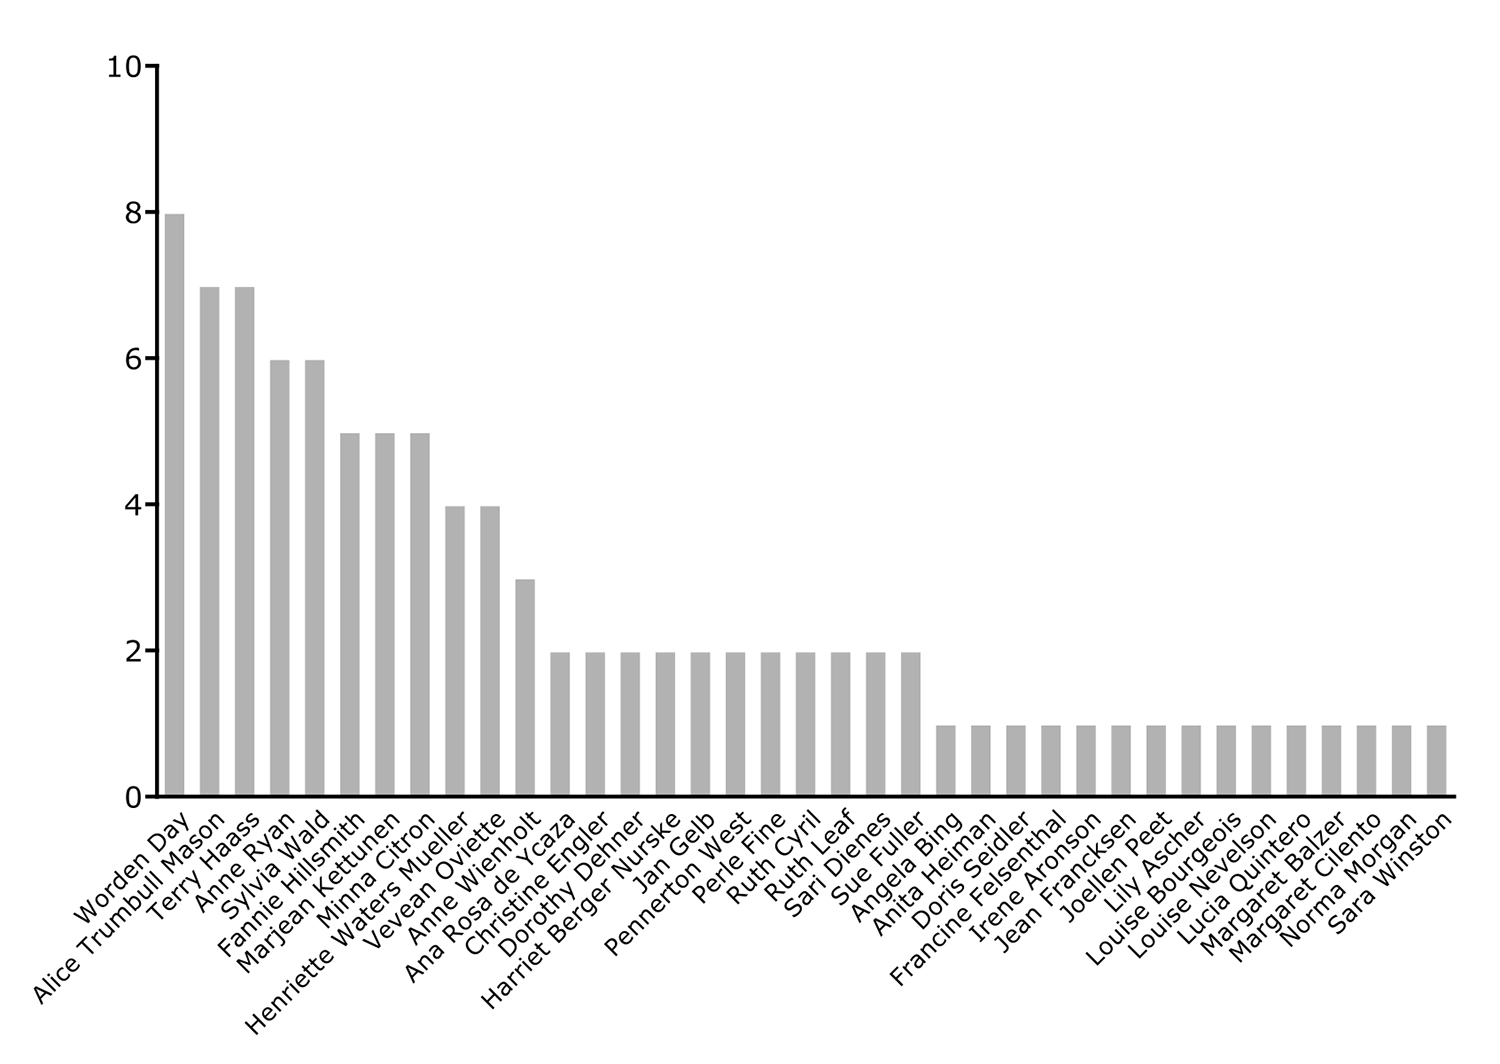
 Chart showing frequency of women artists’ participation in Atelier 17 group shows.
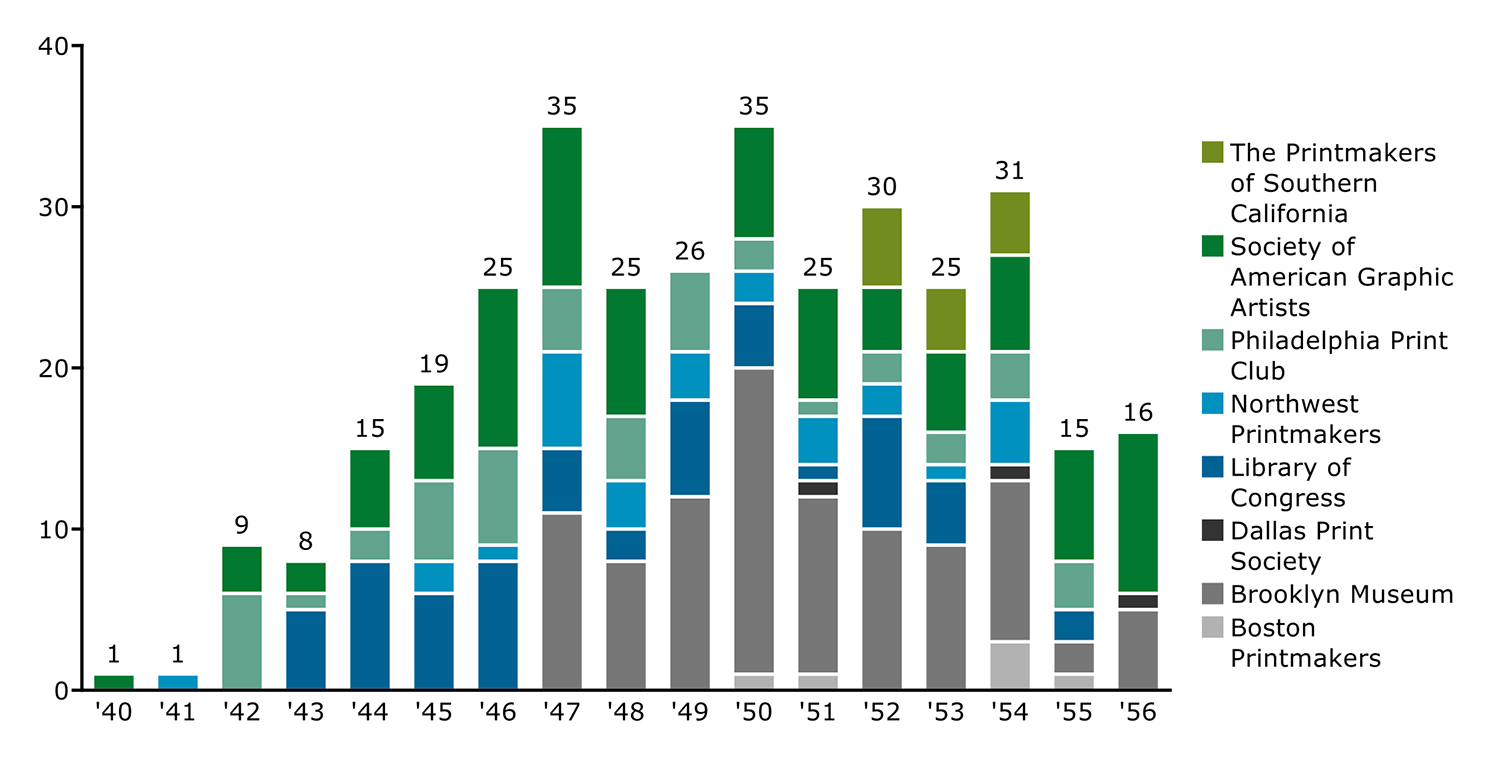
 Chart showing number of Brooklyn Museum print annuals featuring women artists from Atelier 17.
 Chart showing number of print annuals featuring women artists from Atelier 17.
The interactive maps from Viewshare, unfortunately, cannot be reactivated here and, therefore, I refer you back to the Archives of American Art essay for screenshots.
I would be delighted to share my dataset with interested scholars, since it could help others develop other ideas about women artists’ activity at midcentury. If interested, please contact me.
Notes
| words